This article is part of the Trend Technician Technical Analysis Basics series. Be sure to read the rest of the series.
The most commonly used indicator by far is the moving average. Its value is easy to understand intuitively and one of the least controversial indicators. Almost any trader will agree to the value of moving averages.
Moving Average Basics
A moving average represents the average value of an issue over a trailing window. All moving averages are designated in terms of a time span for how many days of trailing data should be included in the average. For example, 10 day, 50 day and 200 day moving averages are commonly used. There are however several ways to calculate this average. The two most common are the simple moving average and the exponential moving average.
Simple Moving Average
The simple moving average is the most obvious type of moving average. For an X day moving average you simply total the values of the previous X days and divide by X. However, in addition to being simple, this method of calculation is somewhat volatile. The fact that all days are given an equal impact on the average leads to a high sensitivity to the value that has just dropped out of the window.
Exponential Moving Average
In an exponential moving average, or EMA the weight of each piece of data decays as it gets farther from the present. While much harder to calculate, these tend to give results that are less subject noise. The impact of each day decays exponentially as it gets farther from the present and thus the most recent data is the most influential.
Trading with Moving Averages
Using these moving averages is fairly straightforward. In general you want to be trading in the direction of the moving average, however there are some caveats:
When price has deviated particularly far from its moving average, there is a good chance it will return and “touch” the MA again. This deviation can be a good opportunity to take profits and re-enter the position when it returns to the moving average.
When a price crosses a moving average, this can indicate a change in trend direction. Many traders will use this as an indicator for a trend change.
Moving averages are integral to trading and are also pivotal in calculating other indicators. They are the basis of most numeric analysis of stocks and understanding them is very important.

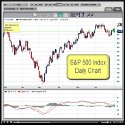
Everyone liked the candlestick video so much I thought I’d point out another cool video that makes a good point about how to look at things simply. Those who’ve been reading my technical analysis basics series can tell that I’m a fan of simple chart analysis. This video gives a great example of looking at trends with an eye for a solid trendline, and using other tools for confirming data.
Given several other indicators of broader economic welfare, most potently the money supply, I’ve got a bit of a bearish feel already. The NASDAQ in particular has been a bit overzealous in it’s climb and seems a possibility for an appealing short. Looking at the trendlines in this video you can see some compelling indications that it may be time to start closing out longs at a bare minimum. Of course the evidence has mounted since this video was made and it was a good opportunity to make some money, or at least save some.
It’s also pretty striking to look at the kind of climb we’ve had without any significant retracement. Even if it’s only a short-term dip, there could very well be some money making opportunities here. I never rush in when fighting the trend long-term, but if you’ve been long you’ve made quite a bit of money and you should at least take a look and see if there’s evidence that the tide might be turning.

No one factor is likely to drive broad trading decisions than inflation. As with so many other factors right now, there are fundamental indicators swinging in both directions when trying to make a call on inflation. The conventional wisdom has been that a recovery will mean inflation due to a policy of quantitative easing, and that if the green shoots aren’t really green, that we’ll have deflation. There are problems with both of these suggestions however.
The Problem with the Deflation Hypothesis
If you look at the CPI numbers you will be impressed with the year over year (yoy) deflation. The recession has been biting us hard and we’ve been tightening our belts driving prices down. That all sounds good except the data don’t seem to support that at all. If you look at the 12 month CPI numbers for June 2009, you’ll see that other
than Transportation and Energy there has been no other sector that has experienced deflation. Let’s be clear about what that means. Despite all the panic going on, overall prices haven’t come in at all except for the collapse of oil prices and the disinterest in cars. This would seem to suggest that once the economy gets moving again we’re going to have rampant inflation once all the money the government has printed gets moving.
The Problem with the Inflation Hypothesis
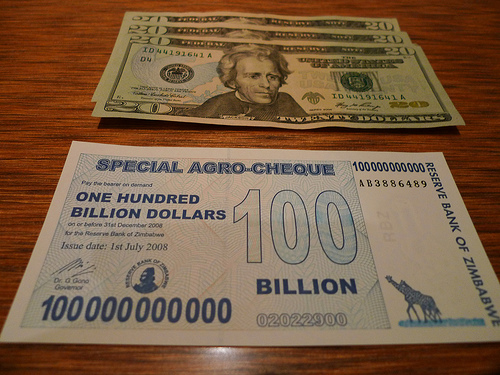
But of course things can’t be that simple. On the flip side of all this is an important fact: A tremendous amount of wealth was destroyed in the financial crisis. While the numbers vary, there are suggestions that somewhere around 40% of the world’s wealth was destroyed by the financial crisis. Imagine the impact of that destruction of wealth on the buying power of the world. If people are not exercising the same purchasing power they did before, then all that money that the government is printing may never gain enough velocity to cause any real inflation. Unless governments printed a lot of money, they’re going to have a hard time counteracting all that destruction of wealth.
Another Case for Technical Analysis
This leads me to the same old drum I’ve been beating all along. In cases like this you have to resort to the technicals (e.g. this free video from INO.com, simply join their mailing list and you’ll get a fantastic resource for free). Buy (or sell) and hold can be disasterous when applied at times of chaos like this. You can be right in the long term and still go broke in the short term. Thus I strongly suggest arming yourself with the tools to make decisions based on market psychology as well as other factors. In addition, in times like this you can hedge your bets with what I call the the “Triple Call Technique.”
Photo Credit: Erik Charlton
This article is part of the Trend Technician Technical Analysis Basics series. Be sure to read the rest of the series.
 Price and volume are the two essential pieces of information from which most technical analysis is derived. Volume reflects the activity of participants in a given issue. Each unit of volume reflects two people’s actions — One participant buys a share, contract or other issue and the other sells one. The total number of issues that changed hands is the volume.
Typically on charts volume is represented as vertical bars at the bottom of the chart. The height of these bars represents the amount of volume for a given period of time. Typically this histogram appears on a chart below the price data. Volume can reflect many elements of the market psychology at a given time.
You can actually look at volume in several dimensions:
- The most obvious is the number of shares, contracts or other issues that traded handeds. This is the most common way to measure volume.
- Another way to look at volume is simply in the number of transactions that took place. The size is irrelevant, simply the number of times some number of shares traded hands. This number can give some insight into the number of participants in a market, but should obviously be taken with a grain of salt and is not widely used.
- Another way to measure volume is the number of price changes that occurred during a given period of time. This measurement can be referred to as tick volume. In this measurement, the number of shares or transactions are irrelevant until the price changes.
Volume is often seens as the primary measure of liquidity in a market. A market which makes many trades a day typically is viewed as more liquid than one which trades fewer. Volume is represented in several indicators, but is sometimes ignored by many traders. It can be an important element in confirming your beliefs on a trade and can be key in analyzing charts. Be sure to pay attention to volume during your trade lest you get false signals.
Photo Credit: Drab Makyo
 Moving averages and chart analysis are the two most fundamental components of technical analysis. Even the most hardened technical analysis skeptic will admit that a moving average has its uses. Being able to read a chart is a key skill and moving averages can help provide an objective piece of insight to the process. Understanding moving averages begins with understanding the different types of indicators available.
Types of Moving Averages
There are many ways to calculate moving averages. The first is a simple moving average in which a given number of days’ values are added up and then divided by the number of days. So for example to calculate a 10 day simple moving average of closing price we would add up the previous 10 days’ close and then divide them by 10. As we did this daily the plotted points would form a useful indicator.
While the simple moving average is handy because it is easy to calculate, an exponential moving average is more commonly used. In this type of moving average the weight of each day’s data decreases as you get further from the current period. Thus as a day gets further in the past its influence on the moving average becomes less, instead of simply disappearing on the day it moves out of the term. While there are many other ways to calculate moving averages, these two are the most commonly used. [More]

The first indicator we will cover in depth is the MACD, or Moving Average Convergance/Divergence. This is predicated on the knowledge of a moving average, which we’ll actually discuss later, but is a pretty simple concept. A moving average is simply the average of the previous number of days. So a 5 day moving average is the average of the previous 5 days closing prices. The EMA, or exponential moving average is a decaying average of some number of days where the more recent days are weighted more heavily.
[More]
When I was in college, my cousin and I decided that we had a brilliant stock market strategy. We would read the Wall Street Journal in the morning, find companies that had positive stories about them and buy them in the morning and sell them in the evening. In the process of trying to implement this naive strategy, I started reading everything I could get my hands on in the stock market. One of the first books that I started reading was Trading For a Living by Alexander Elder. In the intervening time I have yet to find a book that does as good of a job of explaining technicial analysis indicators and their use. [More]