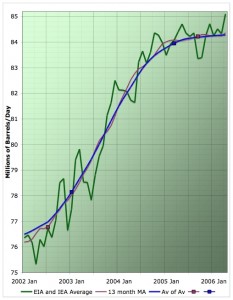
 Moving averages and chart analysis are the two most fundamental components of technical analysis. Even the most hardened technical analysis skeptic will admit that a moving average has its uses. Being able to read a chart is a key skill and moving averages can help provide an objective piece of insight to the process. Understanding moving averages begins with understanding the different types of indicators available.
Types of Moving Averages
There are many ways to calculate moving averages. The first is a simple moving average in which a given number of days’ values are added up and then divided by the number of days. So for example to calculate a 10 day simple moving average of closing price we would add up the previous 10 days’ close and then divide them by 10. As we did this daily the plotted points would form a useful indicator.
While the simple moving average is handy because it is easy to calculate, an exponential moving average is more commonly used. In this type of moving average the weight of each day’s data decreases as you get further from the current period. Thus as a day gets further in the past its influence on the moving average becomes less, instead of simply disappearing on the day it moves out of the term. While there are many other ways to calculate moving averages, these two are the most commonly used.
Using the Averages
Moving averages have many ways they can be used in trading. Prices often have a tendency to “bounce off” of the averages as they trend. As a stock trends up it tends to stay above its moving average but also tends to touch it periodically in the process. This can be useful in identifying what kind of trend you are in for different periods. Traders will often use a 10 day EMA for a short term trend, a 50 day EMA for a medium term trend and a 200 day EMA for a long term trend.
Also with the different time periods associated with these different trends, you can use moving average crossovers as a signal. This is the basis of the MACD histogram. Watching the convergence and divergence of different moving average periods can give you insight into how each trend is changing relatively.
Price crossovers can also be used to watch for a change in trend. If a chart has been trending in one direction, staying above its EMA and then crosses over to the other side, this can be an indicator that the trend has ended. This can be a good time to either close or open a position.
Moving averages are one of the most fundamental concepts to understand in your technical analysis education. Many other indicators are based on them in one way or another. Even if you eschew more complicated indicators they can be useful in simple chart analysis and should be part of any trader’s understanding.


Good post on moving averages. I apply some of these techniques in my trend following. They are an essential tool to trade profitably.
[…] analysis. There you can discover eight must have free online investing tools and everything from using moving averages to money […]