RSS |

Trend Technician

Just another WordPress weblog

Advertisement

Archive for the ‘ Analysis ’ Category

Greece

If you’ve been paying attention to the crisis in Greece, you’re probably curious like I am what’s going to happen there. I’m not sure however that you need a strong opinion in order to make money on it.

The Crisis

Ultimately the crisis in Greece boils down to two things:

  • The Greeks spent too much and lied about it.
  • The other Euro states don’t want them to default, but don’t really want to bail them out.

Germany, the Euro country in the best position to bail them out wants to see serious improvements in their fiscal policy and serious cuts before they extend help.  In fact they’re hoping that just hinting around about giving aid will be enough to calm the bond market down.  It’s not clear however that their populace will put up with the idea of bailing out Greece so that Greeks can retire 10 years before them.  This of course highlights some of the conundrums the EU faces.

The Likely Outcome

Most people think some kind of bail-out will be worked out.  Greece will agree to spending cuts and other criteria and the most fiscally fit EU countries will help them out.  Order will be restored and faith in the EU will be revived.  In fact this is almost assured, because if they don’t bail out Greece, Portugal will probably default right behind them and several countries after that.  The EU can’t afford that kind of crisis so they will help, even though they won’t like it.

If you’re confident in this outcome, you could simply buy calls on the FXE.  Once order is restored in the European Union, the currency rebound and you’ll rake in the easy money.  Of course that’s assuming a lot of things.

The Black Swan

In his book The Black Swan, the author argues (I’m poorly summarizing here), that people by their nature underestimate the likelihood of the improbable.  Because of this you should always bet on the improbable because you’re getting better value for your money.  This is of course a painful strategy to accept, since most of your bets will be losers.  Of course your winners will be magnificent.

In the case of Greece, there is an interesting opportunity to just assume something interesting is going to happen.  Simply buy slightly out of the money calls and slightly out of the money puts.  If order is restored and the FXE rises, the gains should offset your losses on the puts.  If something unforeseen happens, then you will make a fortune on your puts, more than offsetting your losses in the long position.  The only situation in which you lose heavily is if the EU manages to punt the issue down the line and keep the FXE where it is.  So if you think this is a possibility then you probably wouldn’t want to make this trade.

Photo Credit: alaskapine

A lot of traders, myself included, have a tendency to excuse their wrongness with the notion that they were right, just at the wrong time. In fact I have a technique for using calls to alleviate just this issue. John Roque was notorious for warning about how financials would underperform, just before they skyrocketed upward. He now wants us to be skeptical again:

Sadly I was on the same boat with him then and I’m on the same boat with him again. While I generally wouldn’t want to touch financials, if I had to take a position in the “premium” issues, I would be short. Goldman Sachs has had a huge run. It’s priced for a “V” recovery that isn’t going to happen. This isn’t a technical view, but I wouldn’t trust an indicator that told me otherwise.

NASDAQ

Everyone liked the candlestick video so much I thought I’d point out another cool video that makes a good point about how to look at things simply. Those who’ve been reading my technical analysis basics series can tell that I’m a fan of simple chart analysis. This video gives a great example of looking at trends with an eye for a solid trendline, and using other tools for confirming data.

Given several other indicators of broader economic welfare, most potently the money supply, I’ve got a bit of a bearish feel already. The NASDAQ in particular has been a bit overzealous in it’s climb and seems a possibility for an appealing short. Looking at the trendlines in this video you can see some compelling indications that it may be time to start closing out longs at a bare minimum. Of course the evidence has mounted since this video was made and it was a good opportunity to make some money, or at least save some.

It’s also pretty striking to look at the kind of climb we’ve had without any significant retracement. Even if it’s only a short-term dip, there could very well be some money making opportunities here. I never rush in when fighting the trend long-term, but if you’ve been long you’ve made quite a bit of money and you should at least take a look and see if there’s evidence that the tide might be turning.

Click Here to Watch The Video

NASDAQVideo

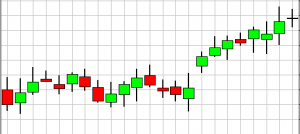
You probably aren’t as familiar with candlestick charts as you should be.  For years I used solely bar charts and trained my mind to read that particular type of chart and I can tell you this:  If you’re not using candlesticks you’re probably leaving money on the table.

Am I saying that candlesticks are better than bar charts?  We’ll get to that as well as a great resource to help you make money using candlesticks, but first let me tell you why you should familiarize yourself with candlestick charts.

As you read more and more charts your brain starts to make subconscious snap interpretations.  You learn a particular type of chart the way you might learn a language.  Before you buy or sell you’ll sit down and do rigorous analysis, but having familiarity helps you parse information quickly.  Learning to read candlesticks gives you another dimension from which to analyze a chart and there’s no reason not to know how to use them.

The Difference of Candlestick Charts

So given that they represent the same data, why do you need candlesticks?  Well if you look at a typical bar chart, a lot of the data is deduced.  You have the same information on a bar chart that you do on a candlestick chart, but some information is not immediately obvious.  Did the stock close higher or lower than it opened?  I can tell this at a glance with a candlestick chart, while I need to read the little nubs on a bar chart to know this.

As I mentioned, the same information is there, but on a candlestick chart some of it has already been processed for me.  Thus my powers of induction are freed to look a little deeper.  From years of experience, my mind can intuit from a bar chart whether a stock went up or down, but that information was obvious to anyone at first glance on a candlestick chart.

The distinct shading of the open and close regions also yields other benefits for helping your mind read a chart quickly.  The candlestick has a tendency to make your mind more aware of the area between the open and close by representing it so visually.  It highlights that difference, where a bar chart does not.  Thus the candlestick chart helps my mind prioritize things that a bar chart doesn’t.

So, are Candlesticks Better?

Candlestick and Bar charts focus on different things and provide different benefits.  Neither is “better,” but this answer to me is clear:  Being able to read both is better than being comfortable with only one.  Why limit your analysis to only one area of emphasis.  Why not be able to get the benefits of both methods?

Learning More about Candlesticks

So now you want to learn more about candlestick charts?  INO’s Trend TV currently has a free video about candlestick charts for its users.  It’s free to sign up, and you’ll have access to the video before you need to decide if you’re interested in the product they offer. They’re also offering three other free videos at this time.

TrendTV's Free Video on Candlestick Charts

TrendTV's Free Video on Candlestick Charts

In this complimentary video, “Advanced Applications of Candlestick Charting,” authors, software programmers, and co-founders of the International Pacific Trading Company, Gary Wagner & Brad Matheny will walk you through:

  • History of candlestick charting
  • How to interpret candlesticks
  • How to merge techniques of Eastern & Western technical analysis together
  • How to merge candlestick techniques with your current trading plan
  • And more…

This 100 minute complimentary video can be found on Trend TV. You don’t have to worry about watching the whole video at once. After you have a password, you can revisit anytime to watch the rest of a video, review a video, or watch other videos on Trend TV.

Go sign up and put another tool in your toolbox.  How can you regret getting more money making weapons for free?  Speaking of which if you haven’t already, be sure to read our technical analysis basics series for more free information.

No one factor is likely to drive broad trading decisions than inflation. As with so many other factors right now, there are fundamental indicators swinging in both directions when trying to make a call on inflation. The conventional wisdom has been that a recovery will mean inflation due to a policy of quantitative easing, and that if the green shoots aren’t really green, that we’ll have deflation. There are problems with both of these suggestions however.

The Problem with the Deflation Hypothesis

If you look at the CPI numbers you will be impressed with the year over year (yoy) deflation.  The recession has been biting us hard and we’ve been tightening our belts driving prices down.  That all sounds good except the data don’t seem to support that at all.  If you look at the 12 month CPI numbers for June 2009, you’ll see that other

Considering Gold?

Gold can be a great way to preserve your value in times of inflation, but it’s all about timing. Get this FREE analysis of gold before you move.

than Transportation and Energy there has been no other sector that has experienced deflation.  Let’s be clear about what that means.  Despite all the panic going on, overall prices haven’t come in at all except for the collapse of oil prices and the disinterest in cars.  This would seem to suggest that once the economy gets moving again we’re going to have rampant inflation once all the money the government has printed gets moving.

The Problem with the Inflation Hypothesis

But of course things can’t be that simple.  On the flip side of all this is an important fact:  A tremendous amount of wealth was destroyed in the financial crisis.  While the numbers vary, there are suggestions that somewhere around 40% of the world’s wealth was destroyed by the financial crisis.   Imagine the impact of that destruction of wealth on the buying power of the world.  If people are not exercising the same purchasing power they did before, then all that money that the government is printing may never gain enough velocity to cause any real inflation.  Unless governments printed a lot of money, they’re going to have a hard time counteracting all that destruction of wealth.

Another Case for Technical Analysis

This leads me to the same old drum I’ve been beating all along.  In cases like this you have to resort to the technicals (e.g. this free video from INO.com, simply join their mailing list and you’ll get a fantastic resource for free).  Buy (or sell) and hold can be disasterous when applied at times of chaos like this.  You can be right in the long term and still go broke in the short term.  Thus I strongly suggest arming yourself with the tools to make decisions based on market psychology as well as other factors.  In addition, in times like this you can hedge your bets with what I call the the “Triple Call Technique.

Photo Credit: Erik Charlton

Natural gas is a tricky trade.  While market psychology plays a huge role even in commodity trades, the price is in the throes of some serious fundamental impacts.  The price skyrocketed to reach spectacular highs in 2008 and has plummeted since.  Even as it has declined, it’s been a popular buy by some as evidenced by the fact that the UNG ETF has run out of shares until regulators approve more. [More]

If you’re trading without a “stop,” you are playing Russian Roulette with your money. “Stop Loss Orders” or “stops” are orders you place with your brokers to indicate that if your position moves against you to a certain point you will exit the trade. You have a “stop price” where if the issue trades at that price or worse, the order turns into a market order to sell or buy. Many traders don’t actually place the order but have a price at which they will exit the trade, which they still call a “stop.” In fact some traders prefer not to place an actual order because they fear they will influence price execution and get “stopped out” when they wouldn’t have otherwise. Regardless of how you execute the exit, you should never enter any position without a price at which you know you’re wrong and get out of the trade.

The Psychology of the Stop

The psychology of trading is fraught with peril.  In many ways once the trade is on you can become fixated on making that trade work out.  The problem is, when you’re doing the research and working out your trade, you’re perfectly rational.  Once you’ve placed the order however, you can start lying to yourself and costing yourself money by convincing yourself to stay with a trade that’s turned against you.  By always trading with a stop, you can set the extent of your trade while you’re still acting completely rationally.  This can be a huge money saver. [More]

General Mills is an interesting analysis candidate.  Many people like to disregard the fundamentals and simply follow the trend, but I see no reason not to put every component in your favor.  If two stocks have similar charts and one has no debt and a great dividend and the other the opposite, I’m going to be much more reluctant to go long on the second one.  Thus let’s start out with some appealing factors about General Mills from a fundamental standpoint.

The first thing that grabs your eye is that it’s sporting a 3.2% dividend yield.  Dividends are particularly appealing in an era of wild uncertainty.  When compared with a stock with no dividend, a stock like this seems to have a much more solid price floor.  A P/E of 15 is not particularly good or bad in this environment.  Lower multiples have been fairly common these days, and I’d like to see it lower; but General Mills is a very well-known stock, and 15 isn’t outrageous.  Interestingly it converts 9 cents of free cash flow for every 1 dollar of sales.  It also has stable margins.  Ultimately all this suggests a boring, but relatively safe bet in the current market. [More]

Gold

Gold is either a really good or really bad investment right now, how do you tell which? When it comes to the fundamentals, the same simple questions is driving gold that’s driving all other issues right now: Are we going to have a recovery and inflation, or continued woes and deflation? This question is particularly important for gold which really has no other utility other than as an inflation hedge, or as a safety play during panic.

Because this one question of whether we’re going to have inflation or deflation drives pretty much all markets right now, how do we answer the question? The answer is: we don’t. The outcomes and time-frames are such a matter of conjecture that trying to decipher the truth is a fool’s errand. In times like this our real goal is to divine the psychology of the market. We don’t care so much whether there’s going to be inflation or deflation, as we care what the market thinks is going to happen.

Obviously if we’re trying to measure market sentiment, technical analysis is our friend. Let’s take a look at some video that I find compelling:

Gold Chart Analysis
Gold Chart

While the section about energy fields is interesting, I find the identification of the head and shoulders pattern much more compelling. How easy is that to trade. If it breaks out to the upside around 1k, then you go long with a stop back inside the range. You would expect some significant run with that breakout as well.

To get a detailed snapshot of gold at the given time you can get a free trend analysis here:

Spot Price of Gold

Free Trend Analysis

Just enter your email and name and you’ll get a detailed analysis of gold prices, completely up to date and completely free. I usually build my charts on the spot price of gold, even though I often trade using the ETFs or another vehicle. Whatever derivatives I may use, they will be driven by the spot price so that’s where I start my analysis. These charts can help make sure you don’t miss out on a big swing.

I think a trading range is a best case scenario at this point. The bulls seem to have run out of steam. The only thing that makes me hesitant is the fact that so many people agree. Analysts on the whole seem to range from neutral to bearish. While there are a few out there who are rah-rah-ing the bull market claims, they really seem marginalized. I’m never comfortable when the consensus is agreeing with me.

I’ve been liking covered calls and I’m liking them even more now. At best we’ll continue with a bull rally I don’t believe in and very possibly worse. If I left my positions uncovered I probably wouldn’t have the conviction not to take profits anyway, so I might as well get paid for putting in my limit order.