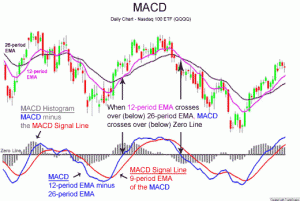
The first indicator we will cover in depth is the MACD, or Moving Average Convergance/Divergence. This is predicated on the knowledge of a moving average, which we’ll actually discuss later, but is a pretty simple concept. A moving average is simply the average of the previous number of days. So a 5 day moving average is the average of the previous 5 days closing prices. The EMA, or exponential moving average is a decaying average of some number of days where the more recent days are weighted more heavily.
The MACD is calculated first by picking a fast and a slow exponential moving average. Typically most of the MACD charts you see use a 12 and 26 day EMA for the fast and slow lines. When MACD is presented it is typically as a histogram, where a signal line is generated as the 9 day EMA of the MACD and then the histogram is MACD – signal. This is the gist of the math for deriving the MACD histogram, if you’d like more detail on it refer to Alexander Elder’s Trading for a Living.
Using MACD
While it’s good to know how to calculate MACD and generate the histogram, knowing how to use it is even better. MACD is generally used as an indicator of a change in trend. When the MACD crosses over the signal line, meaning the histogram crosses over the middle line, that is often seen as a signal to trade in the direction of the crossover. Thus if the histogram goes from below to above, it would suggest to go long and vise versa.
MACD in Context
Like most other indicators MACD is not particularly useful in isolation. Moreover modern market conditions have made it less reliable. It can however give you confirming indication of a trend that is suggested by another indicator. Some other ways to trade MACD are to look for divergences. A divergence is when the underlying chart makes a new high or low, but the MACD does not confirm with the same indication. This can indicate that a trend is losing steam and may be ready to reverse. You will find it in common use as one of the broad indicators in multi-indicators systems.
MACD has fallen somewhat out of favor as compared to its historical usage, but remains a valuable indicator. While one would rarely build a system based solely on this indicator it can be a good source to look for validation of other indicators. It would be foolhardy to ignore it simply because it is not en vogue right now.
Photo Credit: Jenny Downing


Write a Comment