2010 Inflation Predictions
August 12, 2009 | 1 Comments | Analysis, Featured
No one factor is likely to drive broad trading decisions than inflation. As with so many other factors right now, there are fundamental indicators swinging in both directions when trying to make a call on inflation. The conventional wisdom has been that a recovery will mean inflation due to a policy of quantitative easing, and that if the green shoots aren’t really green, that we’ll have deflation. There are problems with both of these suggestions however.
The Problem with the Deflation Hypothesis
If you look at the CPI numbers you will be impressed with the year over year (yoy) deflation. The recession has been biting us hard and we’ve been tightening our belts driving prices down. That all sounds good except the data don’t seem to support that at all. If you look at the 12 month CPI numbers for June 2009, you’ll see that other
Considering Gold?
Gold can be a great way to preserve your value in times of inflation, but it’s all about timing. Get this FREE analysis of gold before you move.
than Transportation and Energy there has been no other sector that has experienced deflation. Let’s be clear about what that means. Despite all the panic going on, overall prices haven’t come in at all except for the collapse of oil prices and the disinterest in cars. This would seem to suggest that once the economy gets moving again we’re going to have rampant inflation once all the money the government has printed gets moving.
The Problem with the Inflation Hypothesis
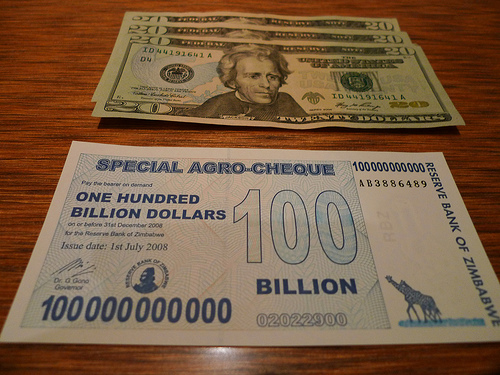
But of course things can’t be that simple. On the flip side of all this is an important fact: A tremendous amount of wealth was destroyed in the financial crisis. While the numbers vary, there are suggestions that somewhere around 40% of the world’s wealth was destroyed by the financial crisis. Imagine the impact of that destruction of wealth on the buying power of the world. If people are not exercising the same purchasing power they did before, then all that money that the government is printing may never gain enough velocity to cause any real inflation. Unless governments printed a lot of money, they’re going to have a hard time counteracting all that destruction of wealth.
Another Case for Technical Analysis
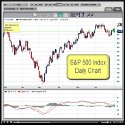
This leads me to the same old drum I’ve been beating all along. In cases like this you have to resort to the technicals (e.g. this free video from INO.com, simply join their mailing list and you’ll get a fantastic resource for free). Buy (or sell) and hold can be disasterous when applied at times of chaos like this. You can be right in the long term and still go broke in the short term. Thus I strongly suggest arming yourself with the tools to make decisions based on market psychology as well as other factors. In addition, in times like this you can hedge your bets with what I call the the “Triple Call Technique.”
Photo Credit: Erik Charlton