A lot of traders, myself included, have a tendency to excuse their wrongness with the notion that they were right, just at the wrong time. In fact I have a technique for using calls to alleviate just this issue. John Roque was notorious for warning about how financials would underperform, just before they skyrocketed upward. He now wants us to be skeptical again:
Sadly I was on the same boat with him then and I’m on the same boat with him again. While I generally wouldn’t want to touch financials, if I had to take a position in the “premium” issues, I would be short. Goldman Sachs has had a huge run. It’s priced for a “V” recovery that isn’t going to happen. This isn’t a technical view, but I wouldn’t trust an indicator that told me otherwise.
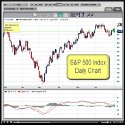
Everyone liked the candlestick video so much I thought I’d point out another cool video that makes a good point about how to look at things simply. Those who’ve been reading my technical analysis basics series can tell that I’m a fan of simple chart analysis. This video gives a great example of looking at trends with an eye for a solid trendline, and using other tools for confirming data.
Given several other indicators of broader economic welfare, most potently the money supply, I’ve got a bit of a bearish feel already. The NASDAQ in particular has been a bit overzealous in it’s climb and seems a possibility for an appealing short. Looking at the trendlines in this video you can see some compelling indications that it may be time to start closing out longs at a bare minimum. Of course the evidence has mounted since this video was made and it was a good opportunity to make some money, or at least save some.
It’s also pretty striking to look at the kind of climb we’ve had without any significant retracement. Even if it’s only a short-term dip, there could very well be some money making opportunities here. I never rush in when fighting the trend long-term, but if you’ve been long you’ve made quite a bit of money and you should at least take a look and see if there’s evidence that the tide might be turning.
Once we understand the concepts of support and resistance we can talk about the two basic states a trend can be in: A trading range and a trend.
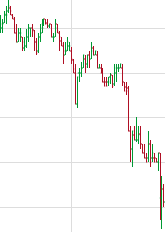
A Downtrend -- Note the lower highs as well as the lower lows.
A trend exists when prices are moving in a direction. When prices are consistently becoming higher, you are in an uptrend and when prices are consistantly lower you are in a downtrend. This distinction may sound arbitrary but the basic definition is that when prices are reaching higher highs and higher lows then the price is moving upwards and vice versa for downwards. When prices are not trending they are considered to be in a trading range. In this state, most prices hit roughly the same highs and the same lows.
Obviously these defintions only make sense in terms of a timespan. A particular issue can be in a long-term uptrend, but a short term downtrend. This is usually defined by what time period a bar represents on a graph and what kind of timespan in which you are planning on executing your trade. Moreover traders oftentimes tend to avoid issues when they are in a trading range, however this can be a great opportunity to profit using options.
Trading Trends and Trading Ranges
The rules of trading trends are fairly obvious. You very rarely want to trade against the trend for the timespan in which you are investing. While you might trade against a long-term trend if you plan on holding for only a short period of time, or against a short-term trend if you’re planning on holding for a long period of time, typically you want to trade with the trend. Additionally, profit taking can be very difficult in trading ranges.
You wouldn’t think that price would merit its own post, but you have to start at the beginning. Price and volume, which we’ll discuss next are the two major components of charts. All the other data is a derivative of these two pieces of data. Price data however is not a simple number. Typically in technical analysis you deal with four distinct price numbers:
Open
High
Low
Close
These four numbers are fairly self explanatory, but let’s go over them quickly anyway. Open is the price at which the issue trades during a given time period. High is the highest price at which an issue trades during a given time period and low is the lowest. Close is the final price of the stock during the time period.
You’ll notice that in this discussion I speak in terms of time periods in a general sense. That’s because charts can have any level of granulatrity. In an intra-day chart, the period in question may be an hour or even in some cases a smaller fraction of time. In other charts, the same time period could be a day or a week or even a month. In any of these cases, however you can still have an open, a high, a low and a closing price.
When charting these prices, you can represent these values in many ways. Probably the most common type of chart is a bar chart. In these types of charts, each period is represented by a bar. The bar stretches from the period’s low to it’s high. It also has a tick on the left side for the open and a tick on the right side for the close. There are other types of charts, which we will discuss later.
The price is probably the most important component of any analysis, but it isn’t the only one. Without understanding volume, which we will discuss next, the price data can be misleading.
I’m not perfect, but then you’ve probably already deduced that. I thought I’d share some experiences with you to show how when people abandon their plan it can be demonstrative of the worst kind of psychological trading problems. These are exactly the kind of things that kill you when you’re making a trade — You enter into your position with a plan and then you decide something has “changed things,” so you abort the plan. In the end you always pay the price for this kind of behavior.
2009 has gotten me this way a couple of times. The problem is that I genuinely believe we’re in circumstances unlike any we’ve seen before. This causes me to “rethink” things far too often for my own good. Here’s a typical example of what I’ve done a couple of times. I decided at one point to go long TLT (Long Term Treasuries) as a hedge against some other positions. I sold a call off the position as well to limit my downside. The plan was if the trade moved the other way I would double up the position to increase my exposure and even out the hedge.
So of course TLT has a huge downward move, much larger than I expected. I start thinking about the economy and I get worried and I decide just to let my current position ride instead of doubling up. Of course TLT recovers part of the way. Had I doubled up my position as I had planned when I entered the position, that trade would have become a neutral one. Instead it was quite a loser and offset the gain in the position it was hedging. [More]
If you’re trading without a “stop,” you are playing Russian Roulette with your money. “Stop Loss Orders” or “stops” are orders you place with your brokers to indicate that if your position moves against you to a certain point you will exit the trade. You have a “stop price” where if the issue trades at that price or worse, the order turns into a market order to sell or buy. Many traders don’t actually place the order but have a price at which they will exit the trade, which they still call a “stop.” In fact some traders prefer not to place an actual order because they fear they will influence price execution and get “stopped out” when they wouldn’t have otherwise. Regardless of how you execute the exit, you should never enter any position without a price at which you know you’re wrong and get out of the trade.
The Psychology of the Stop
The psychology of trading is fraught with peril. In many ways once the trade is on you can become fixated on making that trade work out. The problem is, when you’re doing the research and working out your trade, you’re perfectly rational. Once you’ve placed the order however, you can start lying to yourself and costing yourself money by convincing yourself to stay with a trade that’s turned against you. By always trading with a stop, you can set the extent of your trade while you’re still acting completely rationally. This can be a huge money saver. [More]
General Mills is an interesting analysis candidate. Many people like to disregard the fundamentals and simply follow the trend, but I see no reason not to put every component in your favor. If two stocks have similar charts and one has no debt and a great dividend and the other the opposite, I’m going to be much more reluctant to go long on the second one. Thus let’s start out with some appealing factors about General Mills from a fundamental standpoint.
The first thing that grabs your eye is that it’s sporting a 3.2% dividend yield. Dividends are particularly appealing in an era of wild uncertainty. When compared with a stock with no dividend, a stock like this seems to have a much more solid price floor. A P/E of 15 is not particularly good or bad in this environment. Lower multiples have been fairly common these days, and I’d like to see it lower; but General Mills is a very well-known stock, and 15 isn’t outrageous. Interestingly it converts 9 cents of free cash flow for every 1 dollar of sales. It also has stable margins. Ultimately all this suggests a boring, but relatively safe bet in the current market. [More]
The world of finance has changed amazingly during the rise of the Internet. What used to be expensive pay services are now available for free online. Here are some examples of fantastic information and data that is available absolutely free.
INO’s TV service is an invaluable source of information. The service itself costs about $100 to watch all the educational videos that you want, but you can get 4 for free simply by registering. Of course if you go ahead and subscribe, that will be money well spent as well, but at a minimum you should register and get your four videos for free.
Not that long ago I was writing my own charting software because I couldn’t stand what was available. Now I can get a killer interactive chart tool written in Javascript for free on demand. I don’t have to even download data or anything. Additionally, if I do want the data, I can just hop to the historical data section and download almost everything I could want. You can even download it to a spreadsheet. [More]
Moving averages and chart analysis are the two most fundamental components of technical analysis. Even the most hardened technical analysis skeptic will admit that a moving average has its uses. Being able to read a chart is a key skill and moving averages can help provide an objective piece of insight to the process. Understanding moving averages begins with understanding the different types of indicators available.
Types of Moving Averages
There are many ways to calculate moving averages. The first is a simple moving average in which a given number of days’ values are added up and then divided by the number of days. So for example to calculate a 10 day simple moving average of closing price we would add up the previous 10 days’ close and then divide them by 10. As we did this daily the plotted points would form a useful indicator.
While the simple moving average is handy because it is easy to calculate, an exponential moving average is more commonly used. In this type of moving average the weight of each day’s data decreases as you get further from the current period. Thus as a day gets further in the past its influence on the moving average becomes less, instead of simply disappearing on the day it moves out of the term. While there are many other ways to calculate moving averages, these two are the most commonly used. [More]
Gold is either a really good or really bad investment right now, how do you tell which? When it comes to the fundamentals, the same simple questions is driving gold that’s driving all other issues right now: Are we going to have a recovery and inflation, or continued woes and deflation? This question is particularly important for gold which really has no other utility other than as an inflation hedge, or as a safety play during panic.
Because this one question of whether we’re going to have inflation or deflation drives pretty much all markets right now, how do we answer the question? The answer is: we don’t. The outcomes and time-frames are such a matter of conjecture that trying to decipher the truth is a fool’s errand. In times like this our real goal is to divine the psychology of the market. We don’t care so much whether there’s going to be inflation or deflation, as we care what the market thinks is going to happen.
Obviously if we’re trying to measure market sentiment, technical analysis is our friend. Let’s take a look at some video that I find compelling:
While the section about energy fields is interesting, I find the identification of the head and shoulders pattern much more compelling. How easy is that to trade. If it breaks out to the upside around 1k, then you go long with a stop back inside the range. You would expect some significant run with that breakout as well.
To get a detailed snapshot of gold at the given time you can get a free trend analysis here:
Just enter your email and name and you’ll get a detailed analysis of gold prices, completely up to date and completely free. I usually build my charts on the spot price of gold, even though I often trade using the ETFs or another vehicle. Whatever derivatives I may use, they will be driven by the spot price so that’s where I start my analysis. These charts can help make sure you don’t miss out on a big swing.


 You wouldn’t think that price would merit its own post, but you have to start at the beginning. Price and volume, which we’ll discuss next are the two major components of charts. All the other data is a derivative of these two pieces of data. Price data however is not a simple number. Typically in technical analysis you deal with four distinct price numbers:
 I’m not perfect, but then you’ve probably already deduced that. I thought I’d share some experiences with you to show how when people abandon their plan it can be demonstrative of the worst kind of psychological trading problems. These are exactly the kind of things that kill you when you’re making a trade — You enter into your position with a plan and then you decide something has “changed things,” so you abort the plan. In the end you always pay the price for this kind of behavior.
 If you’re trading without a “stop,” you are playing Russian Roulette with your money. “Stop Loss Orders” or “stops” are orders you place with your brokers to indicate that if your position moves against you to a certain point you will exit the trade. You have a “stop price” where if the issue trades at that price or worse, the order turns into a market order to sell or buy. Many traders don’t actually place the order but have a price at which they will exit the trade, which they still call a “stop.” In fact some traders prefer not to place an actual order because they fear they will influence price execution and get “stopped out” when they wouldn’t have otherwise. Regardless of how you execute the exit, you should never enter any position without a price at which you know you’re wrong and get out of the trade.
 The world of finance has changed amazingly during the rise of the Internet. What used to be expensive pay services are now available for free online. Here are some examples of fantastic information and data that is available absolutely free.
 Moving averages and chart analysis are the two most fundamental components of technical analysis. Even the most hardened technical analysis skeptic will admit that a moving average has its uses. Being able to read a chart is a key skill and moving averages can help provide an objective piece of insight to the process. Understanding moving averages begins with understanding the different types of indicators available.