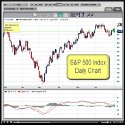
Everyone liked the candlestick video so much I thought I’d point out another cool video that makes a good point about how to look at things simply. Those who’ve been reading my technical analysis basics series can tell that I’m a fan of simple chart analysis. This video gives a great example of looking at trends with an eye for a solid trendline, and using other tools for confirming data.
Given several other indicators of broader economic welfare, most potently the money supply, I’ve got a bit of a bearish feel already. The NASDAQ in particular has been a bit overzealous in it’s climb and seems a possibility for an appealing short. Looking at the trendlines in this video you can see some compelling indications that it may be time to start closing out longs at a bare minimum. Of course the evidence has mounted since this video was made and it was a good opportunity to make some money, or at least save some.
It’s also pretty striking to look at the kind of climb we’ve had without any significant retracement. Even if it’s only a short-term dip, there could very well be some money making opportunities here. I never rush in when fighting the trend long-term, but if you’ve been long you’ve made quite a bit of money and you should at least take a look and see if there’s evidence that the tide might be turning.

This article is part of the Trend Technician Technical Analysis Basics series. Be sure to read the rest of the series.
Once we understand the concepts of support and resistance we can talk about the two basic states a trend can be in: A trading range and a trend.
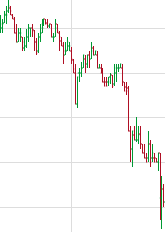
A Downtrend -- Note the lower highs as well as the lower lows.
A trend exists when prices are moving in a direction. When prices are consistently becoming higher, you are in an uptrend and when prices are consistantly lower you are in a downtrend. This distinction may sound arbitrary but the basic definition is that when prices are reaching higher highs and higher lows then the price is moving upwards and vice versa for downwards. When prices are not trending they are considered to be in a trading range. In this state, most prices hit roughly the same highs and the same lows.
Obviously these defintions only make sense in terms of a timespan. A particular issue can be in a long-term uptrend, but a short term downtrend. This is usually defined by what time period a bar represents on a graph and what kind of timespan in which you are planning on executing your trade. Moreover traders oftentimes tend to avoid issues when they are in a trading range, however this can be a great opportunity to profit using options.
Trading Trends and Trading Ranges
The rules of trading trends are fairly obvious. You very rarely want to trade against the trend for the timespan in which you are investing. While you might trade against a long-term trend if you plan on holding for only a short period of time, or against a short-term trend if you’re planning on holding for a long period of time, typically you want to trade with the trend. Additionally, profit taking can be very difficult in trading ranges.