Technical Analysis Basics: Support and Resistance
August 29, 2009 | No Comments | Course
This article is part of the Trend Technician Technical Analysis Basics series. Be sure to read the rest of the series.
Probably the first type of chart analysis to come into play is the analysis of area areas of support and resistance. Support is a price level at which buying increases to either pause or reverse a downtrend. Similarly resistance is a price level at which selling increase to either pause or reverse an uptrend. This sounds complex, but is really quite intuitive in practice.
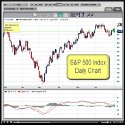
For the purposes of this conversation we’ll assume we’re talking about a stock, although this applies to any traded issue. Intuitively you can imagine that various members of the market see the stock as atractive at a certain level. As the price gets lower and lower more members start to see the stock as underpriced. This effects becomes manifest at a certain price at which there doesn’t remain enough selling power to push it down and the price “bounces off” the support level. In this chart that price is roughly 87. [More]