How to Use Candlestick Charts
January 24, 2010 | No Comments | Analysis, Featured
 You probably aren’t as familiar with candlestick charts as you should be. For years I used solely bar charts and trained my mind to read that particular type of chart and I can tell you this: If you’re not using candlesticks you’re probably leaving money on the table.
Am I saying that candlesticks are better than bar charts? We’ll get to that as well as a great resource to help you make money using candlesticks, but first let me tell you why you should familiarize yourself with candlestick charts.
As you read more and more charts your brain starts to make subconscious snap interpretations. You learn a particular type of chart the way you might learn a language. Before you buy or sell you’ll sit down and do rigorous analysis, but having familiarity helps you parse information quickly. Learning to read candlesticks gives you another dimension from which to analyze a chart and there’s no reason not to know how to use them.
The Difference of Candlestick Charts
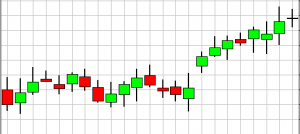
So given that they represent the same data, why do you need candlesticks? Well if you look at a typical bar chart, a lot of the data is deduced. You have the same information on a bar chart that you do on a candlestick chart, but some information is not immediately obvious. Did the stock close higher or lower than it opened? I can tell this at a glance with a candlestick chart, while I need to read the little nubs on a bar chart to know this.
As I mentioned, the same information is there, but on a candlestick chart some of it has already been processed for me. Thus my powers of induction are freed to look a little deeper. From years of experience, my mind can intuit from a bar chart whether a stock went up or down, but that information was obvious to anyone at first glance on a candlestick chart.
The distinct shading of the open and close regions also yields other benefits for helping your mind read a chart quickly. The candlestick has a tendency to make your mind more aware of the area between the open and close by representing it so visually. It highlights that difference, where a bar chart does not. Thus the candlestick chart helps my mind prioritize things that a bar chart doesn’t.
So, are Candlesticks Better?
Candlestick and Bar charts focus on different things and provide different benefits. Neither is “better,” but this answer to me is clear: Being able to read both is better than being comfortable with only one. Why limit your analysis to only one area of emphasis. Why not be able to get the benefits of both methods?
Learning More about Candlesticks
So now you want to learn more about candlestick charts? INO’s Trend TV currently has a free video about candlestick charts for its users. It’s free to sign up, and you’ll have access to the video before you need to decide if you’re interested in the product they offer. They’re also offering three other free videos at this time.
In this complimentary video, “Advanced Applications of Candlestick Charting,” authors, software programmers, and co-founders of the International Pacific Trading Company, Gary Wagner & Brad Matheny will walk you through:
- History of candlestick charting
- How to interpret candlesticks
- How to merge techniques of Eastern & Western technical analysis together
- How to merge candlestick techniques with your current trading plan
- And more…
This 100 minute complimentary video can be found on Trend TV. You don’t have to worry about watching the whole video at once. After you have a password, you can revisit anytime to watch the rest of a video, review a video, or watch other videos on Trend TV.
Go sign up and put another tool in your toolbox. How can you regret getting more money making weapons for free? Speaking of which if you haven’t already, be sure to read our technical analysis basics series for more free information.


