Technical Analysis Basics: Price
August 2, 2009 | No Comments | Course, Other Stories, Personal Experience
This article is part of the Trend Technician Technical Analysis Basics series. Be sure to read the rest of the series.
 You wouldn’t think that price would merit its own post, but you have to start at the beginning. Price and volume, which we’ll discuss next are the two major components of charts. All the other data is a derivative of these two pieces of data. Price data however is not a simple number. Typically in technical analysis you deal with four distinct price numbers:
- Open
- High
- Low
- Close
These four numbers are fairly self explanatory, but let’s go over them quickly anyway. Open is the price at which the issue trades during a given time period. High is the highest price at which an issue trades during a given time period and low is the lowest. Close is the final price of the stock during the time period.
You’ll notice that in this discussion I speak in terms of time periods in a general sense. That’s because charts can have any level of granulatrity. In an intra-day chart, the period in question may be an hour or even in some cases a smaller fraction of time. In other charts, the same time period could be a day or a week or even a month. In any of these cases, however you can still have an open, a high, a low and a closing price.
When charting these prices, you can represent these values in many ways. Probably the most common type of chart is a bar chart. In these types of charts, each period is represented by a bar. The bar stretches from the period’s low to it’s high. It also has a tick on the left side for the open and a tick on the right side for the close. There are other types of charts, which we will discuss later.
The price is probably the most important component of any analysis, but it isn’t the only one. Without understanding volume, which we will discuss next, the price data can be misleading.

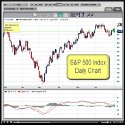
Price Data From a Bar Chart
 I’m not perfect, but then you’ve probably already deduced that. I thought I’d share some experiences with you to show how when people abandon their plan it can be demonstrative of the worst kind of psychological trading problems. These are exactly the kind of things that kill you when you’re making a trade — You enter into your position with a plan and then you decide something has “changed things,” so you abort the plan. In the end you always pay the price for this kind of behavior.