This article is part of the Trend Technician Technical Analysis Basics series. Be sure to read the rest of the series.
Probably the first type of chart analysis to come into play is the analysis of area areas of support and resistance. Support is a price level at which buying increases to either pause or reverse a downtrend. Similarly resistance is a price level at which selling increase to either pause or reverse an uptrend. This sounds complex, but is really quite intuitive in practice.
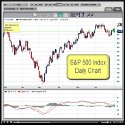
For the purposes of this conversation we’ll assume we’re talking about a stock, although this applies to any traded issue. Intuitively you can imagine that various members of the market see the stock as atractive at a certain level. As the price gets lower and lower more members start to see the stock as underpriced. This effects becomes manifest at a certain price at which there doesn’t remain enough selling power to push it down and the price “bounces off” the support level. In this chart that price is roughly 87.

Support and Resistance (Blue and Red)
The same effect happens in the positive direction as well. As the price raises participants increasingly lose their conviction in the stock. Eventually it reaches a price at which equilibrium is reached, at least temporarily and the price “bounces off” downward. This is a resistance level.
Interestingly, like many technical indicators, this effect is more pronounced because other traders believe in it. As the price approaches a support level, more players will go long to see if the price will reverse. This additional buying tends to create a self-fulfilling prophecy.
Strength of Support and Resistance
These effects are easy to see in a chart. Over time there are obvious price levels at which price movements either slow down or stop their directional movement. The more times a price fails to penetrate a line of support or resistance, the stronger the effect is pereceived to be. Each time the bears or bulls fail to penetrate a given line, the less optimistic they will be about breaching it.
Addtionally support or resistance in longer term charts tends to be perceived as more meaningful than in short term charts. There are typically levels of support and resistance in each time period and they should be approach holistically. Don’t ignore the long term support and resistance just because you’re making a short-term trade.
Trading Support and Resistance

Prices Can Only Stretch So Far
Trading using support and resistance lines is very basic and should be considered in just about any strategy. Even the most complex strategy will usually pay heed to support and resistance lines. Support and resistance lines can provide great index lines for where to enter or exit trades. Additionally they can provide “stops” that indicate when your trade has moved against you.
In a simple example, when a stock “boucned” off it’s support, you might buy and then place a stop just on the other side of its support. Thus if you’re right, the price will continue away from the support and you will make money. If the stock moves the other way and pierces the support level, there is evidence you picked the wrong time to get in. Support and resistance levels also provide good places to tighten your stops in positions you’ve already taken.
Ultimatley noting areas of support and resistance will become second nature. They are both one of the most obvious and one of the most important components of chart analysis. It pays to pay attention to them.
Photo Credit: fazen


Write a Comment